Step 1.1: Quality check
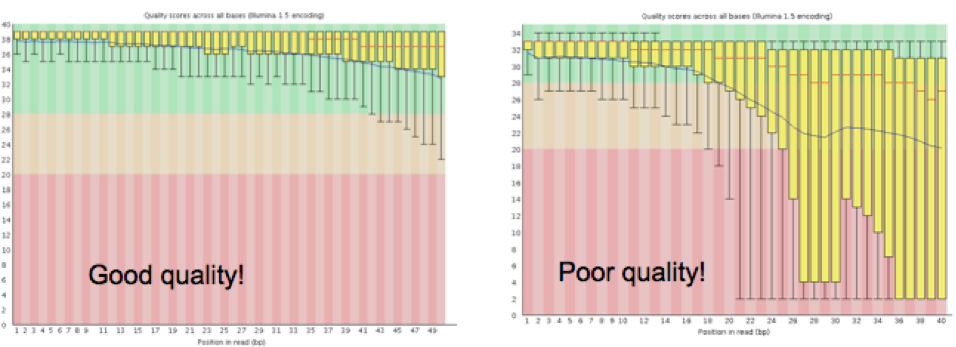
The overall quality of the sequence information received from the sequencing center will determine how the quality trimming should be set up in Step 1.2. Tools like FastQC1 will enable the collection of this information. Sequencing facilities usually produce read files in FASTQ format, which contain a base sequence and a quality score for each base in a read. FastQC measures several metrics associated with the raw sequence data in the FASTQ file, including read length, average quality score at each sequenced base, GC content, presence of any overrepresented sequences (k-mers), and so on. The key metric to watch for is the graph representing the average quality scores (see Figure 2), and the range of scores at each base along the length of the reads (reads are usually the same length at this time, and this length is the X-axis, the Y-axis has the quality scores). Note that for large projects, you may collate all of the FastQC reports by using a tool like MultiQC2. MultiQC will generate an html file that visually summarizes these metrics across all samples, as well as provide tab-delimited files containing all the FastQC stats.
 |
|---|
| Figure 2. Graphs generated by FastQC detailing the average quality scores across all reads at each base. |
Bibliography
-
Andrews, S. (2010). FastQC: a quality control tool for high throughput sequence data. ↩
-
Ewels, P., Magnusson, M., Lundin, S., & Käller, M. (2016). MultiQC: summarize analysis results for multiple tools and samples in a single report. Bioinformatics, 32(19), 3047-3048. ↩

This work is licensed under a Creative Commons Attribution-NonCommercial-ShareAlike 4.0 International License.