Step 3.1: QC and outlier/batch detection
Alignment-based counts can normally be imported directly into R/Bioconductor1 , but estimated counts generated using Protocol 2 above will require importing using the tximport2 Bioconductor library. This can also be used to summarize transcript-level information to gene counts.
As mentioned above, estimated transcript-level counts can be used in standard differential gene expression analyses steps, but these should be imported using tools like tximport2 (for R/Bioconductor). We also recommend using these tools to sum transcript-level information to gene-level counts for initial analyses.
Once the counts have been generated, it is good practice to do some QC checks in addition to the ones listed above and to cluster the samples to see if there are any outliers or batch effects. Batch effects are usually caused by obtaining or processing the samples in batches and can obscure detection of expression differences if not adjust for statistically.
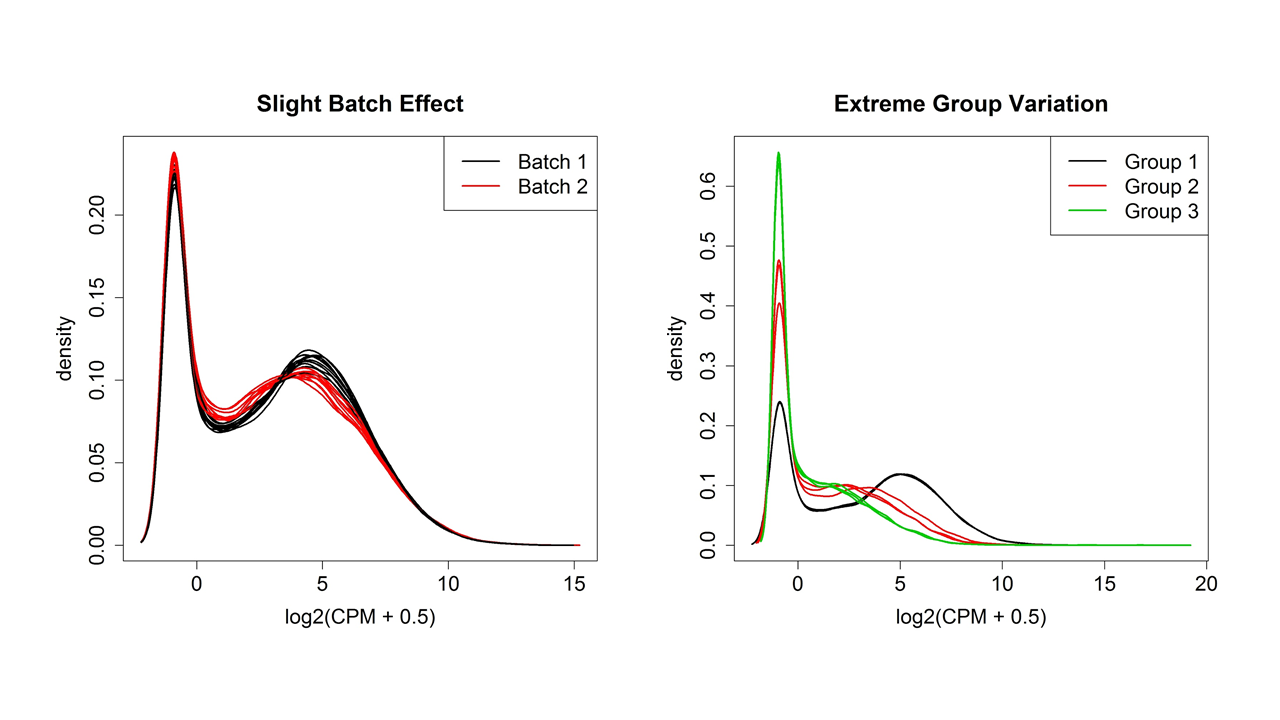
Figure 4 shows two examples of variation between samples plotted using the plotDensity function from the affy3 package in R (although the plotDensities function from the limma package4 is a newer choice). Whatever the shape of the distribution, ideally it will be about the same for all samples. One or two samples that are very different could be outliers, but if there are two or more distinct groups, see if they correspond to treatment groups or known or unknown batch effects.
There are other QC steps that are recommended, like simple hierarchical clustering (hclust + plot functions in base R) or Multidimensional Scaling clustering (plotMDS function in the limma package4). This will help validate the presence of outliers. Note that while StringTie5 has facilities for count generation, normalization and statistical analysis, it does not have any internal methods for sample QC or clustering. Instead, the R statistical software and add-on packages from Bioconductor1 are an excellent way to handle all aspects of statistical analysis of RNA-Seq data. They are free and available for any computer platform, although the command line interface can have a steep learning curve. Learning how to use R is well worth the time investment as it is a general tool for any sort of data manipulation, statistical analyses and graphing needs.
 |
|---|
| Figure 4. Distributions of normalized expression values showing slight and extreme group/batch effects. |
Bibliography
-
Gentleman, R. C., Carey, V. J., Bates, D. M., Bolstad, B., Dettling, M., Dudoit, S., … & Hornik, K. (2004). Bioconductor: open software development for computational biology and bioinformatics. Genome biology, 5(10), R80. ↩ ↩2
-
Soneson, C., Love, M. I., & Robinson, M. D. (2015). Differential analyses for RNA-seq: transcript-level estimates improve gene-level inferences. F1000Research, 4. ↩ ↩2
-
Gautier L, Cope L, Bolstad BM, Irizarry RA (2004). affy—analysis of Affymetrix GeneChip data at the probe level. Bioinformatics, 20(3), 307–315. ISSN 1367-4803, ↩
-
Ritchie, ME, Phipson, B, Wu, D, Hu, Y, Law, CW, Shi, W, and Smyth, GK (2015). limma powers differential expression analyses for RNA-sequencing and microarray studies. Nucleic Acids Research 43(7), e47. ↩ ↩2
-
Pertea, M., Pertea, G. M., Antonescu, C. M., Chang, T. C., Mendell, J. T., & Salzberg, S. L. (2015). StringTie enables improved reconstruction of a transcriptome from RNA-seq reads. Nature biotechnology, 33(3), 290. ↩

This work is licensed under a Creative Commons Attribution-NonCommercial-ShareAlike 4.0 International License.