Step 1.3: Quality recheck
Once the trimming step is complete, it is always good practice to make sure that your dataset looks better by rerunning FastQC on the trimmed data. The metrics to compare between trimmed and raw fastq data, in the context of the tool FastQC are listed below:
- Sequence length and Sequence length distribution (the minimum will be lower in trimmed data)
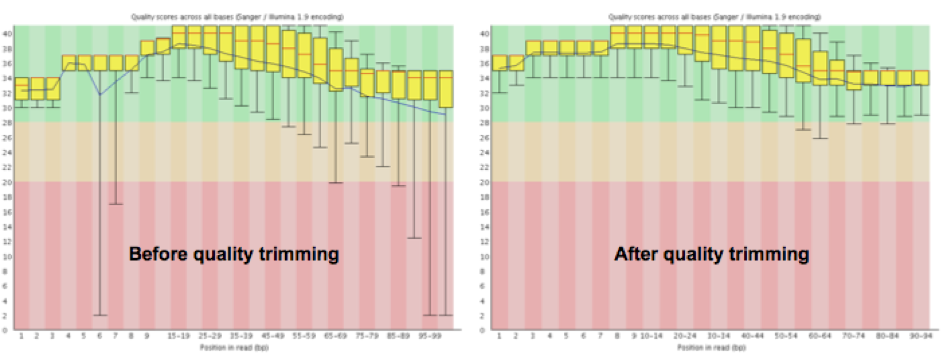
- The quality score graph (majority of the bases will have a minimum quality value at or above 30, see Figure 3 below)
- Per base sequence content (should remain about the same)
 |
|---|
| Figure 3. Graphs generated by FastQC detailing the change in average base quality across all reads after trimming in an example dataset. |
Bibliography

This work is licensed under a Creative Commons Attribution-NonCommercial-ShareAlike 4.0 International License.